Acton Property Prices Surge to New All-time High
But estate agents feeling pain as number of sales plummets
Acton property prices appear to have not been affected by the result of the EU referendum vote with new record highs being reached according to the latest numbers.
The Land Registry has released data showing that the average price of a home sold in the W3 post code area during the third quarter of the year was £647,285 a rise of 12.7% over the same period last year.
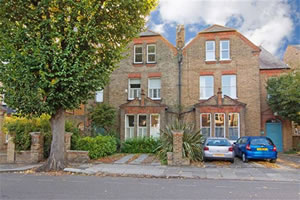
With the vote for Brexit taking place on 23 June these numbers are for sales made after the result. They included the sale of a house on Cumberland Road for £2,250,000. The six bedroom, three bathroom freehold property becomes the fourth most expensive home in Acton.
There will be concern among estate agents and developers about the number of transactions taking place particularly with a large amount of new supply coming to the market. Only 57 transactions have been reported so far for the months of July to September and, while there may be some late sales to add to this number, they are unlikely to significantly change the overall picture. The current level of sales is over 80% down on what it was a decade ago and anecdotally local estate agents have been hit hard by the lack of business.
The Land Registry numbers suggest that sales of the new flats in the area are very slow and with thousands of units in the pipeline in developments such as Acton Gardens, there may be cause for concern about how long they will take to sell.
The Land Registry’s House Price Index is showing that the average price of a home sold in London in August was £488,908 which is up 12.1% over the same month last year. For the UK as a whole the index shows and average price of £218,964 up by 8.4% compared to the previous year.
The short term indications for the market appear to be positive. Mortgage approvals for house purchases rose to a three-month high in September according to the Bank of England, and RICS, the surveyors’ industry group, have reported that buyer inquiries were the highest since February. They say this indicates that market activity is recovering after a quieter period earlier in the year due to uncertainty over the referendum.
In a forthcoming edition of the ActonW3.com newsletter there will be a complete listing of recent property sales in the area. To register to receive it .
| Acton Property Prices (July-September 2016) | ||||||||
|---|---|---|---|---|---|---|---|---|
| Area | Semi-det | Sales | Terraced | Sales | Flat/ mais |
Sales | Overall Ave |
Total Sales |
| W3 0 | 761000 | 1 | 787500 | 2 | 0 | 0 | 778667 | 3 |
| W3 6 | 2250000 | 1 | 1173750 | 2 | 469657 | 16 | 637474 | 19 |
| W3 7 | 1007500 | 2 | 0 | 0 | 382911 | 14 | 460984 | 16 |
| W3 8 | 0 | 0 | 731250 | 2 | 471000 | 5 | 545357 | 7 |
| W3 9 | 1371667 | 6 | 900000 | 1 | 424800 | 5 | 937833 | 12 |
| Total | 1325600 | 10 | 897857 | 7 | 433856 | 40 | 647285 | 57 |
| Change in Quarter | 30.9% | 11.1% | 3.7% | -41.7% | 4.9% | -39.4% | 20.2% | -35.2% |
| Change in year | 23.8% | -65.5% | 13.6% | -77.4% | 4.9% | -71.8% | 12.7% | -72.3% |
| Change in three years | 62.3% | -60.0% | 42.6% | -82.5% | 41.8% | -71.0% | 41.8% | -72.9% |
| Change in five years | 165.6% | -33.3% | 73.0% | -78.1% | 77.6% | -53.5% | 90.9% | -57.1% |
| Change in ten years | 159.8% | -74.4% | 117.4% | -90.0% | 93.0% | -81.5% | 111.9% | -82.6% |
November 10, 2016
Related links
|

