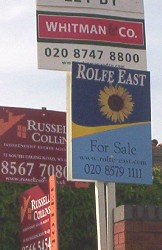
Local property market struggling as prices and volumes fall
Brentford property dream a thing of the past?
The prospect of large numbers of unoccupied flats in the Brentford area is looming following the publication of the latest set of figures from the Land Registry. They suggest a sharp fall in the number of transactions in the local property market. Home sales fell by nearly 70% compared to the same time last year.
 |
With only 44 properties changing hands in a three month period the market is as quiet as it was during the period of uncertainty following the September 11th attack on the World Trade Centre. The rest of the country also saw a fall in volumes but not to the same extent as Brentford.
With hundreds of new units still to come to the market a glut of properties is looming unless agents can sell properties more effectively.
The only releif is in sales of terraced houses, where the figures show an increase over the previous 12 months of 18%. However the fact that only nine such properties changed hands will surely set alarm bells ringing locally.
The figures show that the average price of a Brentford property is now £256,755. Brentford prices are down by 7.2% over the last year compared to a 9.8% rise for London and a 11.8% national increase.
The figures suggest a worrying time ahead for local estate agents if the trend continues. With such a small turnover of property in the area, a shake-out of the sector is likely this year if a pick up in volumes does not happen. If prices start to fall too, 2005 could be a miserable year for local estate agents.
Property Price Statistics, Jan - Mar 2005
| Jan - Mar 2005 | Detached |
Semi-Detached |
Terraced |
Flat/Maisonette |
Overall |
||||||
| Region/Area | Av Price £ |
Sales |
Av Price £ |
Sales |
Av Price £ |
Sales |
Av Price £ |
Sales |
Av Price £ |
Sales |
|
| TW8 0 | 0 |
0 |
0 |
0 |
0 |
0 |
213993 |
8 |
213993 |
8 |
|
|
0 |
0 |
0 |
0 |
389333 |
3 |
270908 |
18 |
287825 |
21 |
|
|
0 |
0 |
261316 |
3 |
283666 |
6 |
175833 |
6 |
236062 |
15 |
|
|
|
- |
- |
261316 |
3 |
318888 |
9 |
238853 |
32 |
256755 |
44 |
|
|
- |
- |
-11.6% |
-70.0% |
29.9% |
-55.0% |
-15.9% |
-46.7% |
-7.2% |
-51.1% |
|
|
- |
- |
-21.9% |
-57.1% |
18.7% |
-73.5% |
-10.1% |
-67.7% |
-4.8% |
-68.6% |
|
Property Price Statistics, Oct - Dec 2004
| Sep-Dec 2004 | Detached | Semi-Detached | Terraced | Flat/Maisonette | Overall | ||||||
|
Av Price £ | Sales | Av Price £ | Sales | Av Price £ | Sales | Av Price £ | Sales | Av Price £ | Sales | |
|
0 | 0 | 0 | 0 | 243955 | 10 | 273681 | 19 | 263430 | 29 | |
|
0 | 0 | 241875 | 4 | 0 | 0 | 323947 | 24 | 312222 | 28 | |
|
0 | 0 | 329991 | 6 | 248583 | 6 | 189057 | 7 | 252360 | 19 | |
|
|
294745 | 10 | 245691 | 16 | 285961 | 50 | 278639 | 76 | |||
|
-5.3% | -33.3% | -9.8% | -27.3% | 29.8% | -58.0% | 17.9% | -51.3% | |||
|
6.7% | -16.7% | -9.0% | -48.4% | 1.2% | -59.7% | -0.4% | -54.5% | |||
Source: Land registry
May 11, 2005
Related links
| Related Links |
|
More
Property Listings for TW8 than anywhere else - Start
your hunt for property here.
Where do I live? Brentford TW8 postcodes are divided into three sectors, TW8 0xx, TW8 8xx and TW8 9xx. Broadly speaking, TW8 0xx covers areas east of Boston Manor Road, TW8 8xx goes west of Boston Manor Road, whilst TW8 9xx covers the areas to the north of the A4. The mix of properties on offer makes it hard to draw conclusions on property price trends - one cannot fairly compare a one bedroom former local authority property with a three bedroom apartment overlooking Kew Gardens. |
| Participate |
Become a member of BrentfordTW8.com - it's free Comment on this story on the |