TW8 Property Still in Doldrums
Sales recovery poor compared to rest of West London
The latest official figures show that Brentford is not experiencing the sharp upturn in the number of property sales that have been seen elsewhere in London.
Whereas areas like Ealing and Chiswick have seen the number of sales rise by over 50% compared to the same period last year, Brentford is seeing a comparatively anaemic rise in the number of transactions.
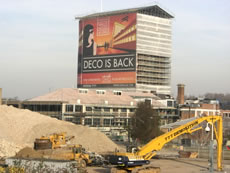
This is likely to cause further concern for the developers of large blocks of flats in the area because the numbers do include sales of units in Beecham House, Firestone House and Wallis House. With hundreds of new properties still to be marketed it is likely that there will be an overhang on property prices for some time to come. Over the last 5 years Brentford prices have risen by only 7.6% meaning that there is little speculative interest in buying flats in the area.
Prices remain reasonably stable with the average home in TW8 during the third quarter of 2009 changing hands for £252,926. This represents a 9.9% fall from the same period last year.
London's annual house price change to the end of September according to the Land Registry is -3.2 %, which is the sixth month in a row in which London's rate of fall has eased. The average value of a property in London is now £314,954.
Right Move's House Price index, which is based on offered prices rather than sales prices, is showing that in October in London prices were back to an all-time high. The majority of buyers are expecting more rises and only 1 in 10 expecting falls
The Land Registry figures for England and Wales as a whole in September show an annual movement of -5.6%. This brings the average house price in England and Wales to £158,377. This is the fifth month in a row where the annual rate of decline has eased.
The latest survey of Chartered Surveyors for the RICS also shows the market recovering with London appearing to be the strongest area.
Jeremy Leaf, a spokesperson for the RICS said, " Although the supply of property is beginning to pick-up, it is still insufficient to keep pace with the increase in demand which points to further prices gains in the near term. Cheap money remains a critical prop for the market and this is being reflected in the continuing appetite for finance from first-time buyers despite the large deposits still being demanded by lenders."
The numbers below are subject to revision as is it usual that some properties are added late to the Land Registry's database.
Brentford Property Prices, July - September 2009
| Area | Semi-Det | Sales | Terrace | Sales | Flat/ Mais |
Sales | Total Avg. | Total Sales |
|---|---|---|---|---|---|---|---|---|
| TW8 0 | 0 | 0 | 274992 | 7 | 270156 | 28 | 271123 | 35 |
| TW8 8 | 0 | 0 | 0 | 0 | 177333 | 3 | 177333 | 3 |
| TW8 9 | 286875 | 4 | 0 | 0 | 143740 | 5 | 207356 | 9 |
| Total | 286875 | 4 | 274992 | 7 | 244863 | 36 | 252926 | 47 |
| Change in Quarter | 16.4% | -42.9% | -2.3% | -30.0% | 0.0% | 111.8% | -1.2% | 38.2% |
| Change in year | - | - | -20.5% | 0.0% | -8.7% | 0.0% | -9.9% | 9.3% |
| Change in 3 years | 4.9% | -66.7% | -12.6% | -81.6% | -1.3% | -41.0% | -7.6% | -57.7% |
| Change in 5 years | -3.0% | -73.3% | -1.2% | -69.6% | 10.1% | -70.2% | 6.5% | -70.4% |
Where do I live? Brentford TW8 postcodes are divided into three sectors, TW8 0xx, TW8 8xx and TW8 9xx. Broadly speaking, TW8 0xx covers areas east of Boston Manor Road, TW8 8xx goes west of Boston Manor Road, whilst TW8 9xx covers the areas to the north of the A4.
Source: Land Registry
January 12, 2010
