Second Highest Price Ever Paid for House in Brentford
Bright spot in property market that ended 2019 with a whimper
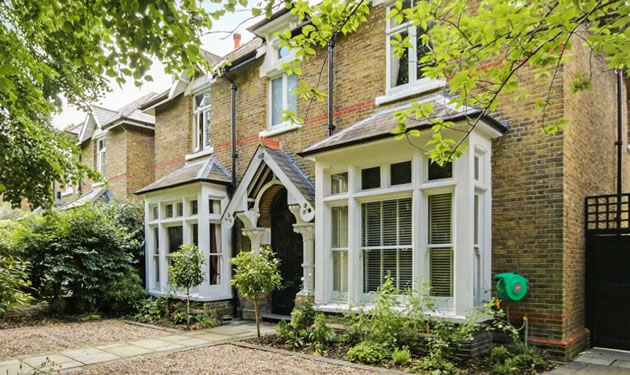
House on The Butts became Brentford's second most expensive
In an otherwise moribund Brentford property market a sale of a house in the Butts stands out in the latest list of transactions from the Land Registry.
The six bedroom house sold for £2,575,000 well below the guide price of £2,950,000. It includes a cellar, a drawing room with an open fire and an integrated home cinema with a rear garden that is described as spectacular.
The price makes it the second most expensive house in the TW8 postcode area with the record being set at £3,265,000 for a property on Upper Butts sold back in 2014. The highest price paid for any sort of home in the area was £4,550,000 laid out for the penthouse apartment in Provenance House on Kew Bridge Road in 2015.
Otherwise activity more or less ground to a halt towards the end of last year with just 36 sales reported in the area in the fourth quarterr. The average price was £515,333 up by 3.6% over the year.
Sales of new build units remained slack with just three selling during the quarter. However, there is some optimism among local agents that the significant supply set to come to the market in the near future from the Ballymore project and the Brentford Stadium enabling development can be absorbed.
Henry Lane, Head of Culture, at Thorgills Estate Agents says, "Brentford's property scene is alive and thriving - the number of flats sold in Brentford in the last three months has increased 23% and prices have increased ever so slightly at 0.5% since the summer of 2019. The turnover of house sales in Brentford is much lower than that of flats, as people tend to live in houses for longer periods of time, so there is less data to draw averages from but the signs are certainly positive.
"Bearing in mind that Brexit delays and the general election took place in the last quarter, the property market in Brentford weathered the perceived storm rather well. Looking to what we can expect next quarter, progress is now evident at the long-dormant Ballymore site which gives credence to the 'up and coming' description of Brentford and inspires confidence in those moving to existing properties in the area."
Another agent who preferred not to be named said, “Ballymore will throw everything at ‘The Brentford Project’ and it does have a lot going for it, particularly location, if they get the pricing right. I’ve have a number of clients who live in west London and who have done well out of investments they have made in the Brentford area. They would be well disposed to acquiring more. Ballymore just need to avoid being too greedy on service charges and offering the right sort of incentives to buyers.”
| Brentford Property Prices - (October - December 2019) | ||||||||
|---|---|---|---|---|---|---|---|---|
| Area | Semi-det | Sales | Terrace | Sales | Flat/ mais |
Sales | Overall Ave | Total Sales |
| TW8 0 | 0 | 0 | 633333 | 3 | 389100 | 10 | 445462 | 13 |
| TW8 8 | 860000 | 1 | 0 | 0 | 532550 | 10 | 562318 | 11 |
| TW8 9 | 722500 | 2 | 715750 | 4 | 377917 | 6 | 547958 | 12 |
| Total | 768333 | 3 | 680429 | 7 | 441692 | 26 | 515333 | 36 |
Change |
34.4% | -62.5% | 17.0% | -46.2% | 0.5% | 23.8% | 0.7% | -16.3% |
Change |
15.3% | -25.0% | 5.7% | -36.4% | -4.8% | -62.3% | 3.6% | -57.1% |
Change |
- | - | 30.8% | -12.5% | 11.0% | -64.4% | 25.7% |
-55.6% |
| Change in 5 years |
85.1% | 200.0% | 24.8% | -58.8% | 18.0% | -79.5% | 28.4% |
-75.3% |
Change |
- | - | 90.6% | -53.3% | 82.5% | -29.7% | 87.3% |
-30.8% |
Where do I live? Brentford TW8 postcodes are divided into three sectors, TW8 0xx, TW8 8xx and TW8 9xx. Broadly speaking, TW8 0xx covers areas east of Boston Manor Road, TW8 8xx goes west of Boston Manor Road, whilst TW8 9xx covers the areas to the north of the A4.
Source: Land Registry

For the country as a whole prices grew by 1.4% in 2019 to reach an average of £215,282 according to the Nationwide House Price Index. The figures from National Statistics show a 2.2% rise to November 2019 to an average of £235,298.
Commenting on the figures, Robert Gardner, Nationwide's Chief Economist, said, “January saw a further modest pick-up in annual UK house price growth to 1.9%, from 1.4% in December. This follows twelve 12 successive months in which annual price growth had been below 1%.
“Indicators of UK economic activity were fairly volatile for much of 2019, but the underlying pace of growth slowed through the year as a result of weaker global growth and an intensification of Brexit uncertainty.
“Recent data continue to paint a mixed picture. Economic growth appeared to grind to a halt as 2019 drew to a close, though business surveys point to a pickup at the start of the New Year. “
The Royal Institution of Chartered Surveyors’ (RICS) November 2019 UK Residential Market Survey reported that key measures of buyer demand point to sales remaining in negative territory, the uncertainty surrounding the 2019 General Election and Brexit being the likely cause of suppressed activity. However, there is an expectation that a more stable trend is likely to emerge over the coming three months.
The Bank of England’s Agents’ summary of business conditions – 2019 Q4 reported that the housing market remained subdued, mainly due to the October Brexit deadline and the General Election. Contacts reported that house prices were modestly down on a year ago in the south and modestly up elsewhere.
Robert Gardner added, “Looking ahead, economic developments will remain the key driver of housing market trends and house prices. Much will continue to depend on how quickly uncertainty about the UK’s future trading relationships lifts, as well as the outlook for global growth. Overall, we expect the economy to continue to expand at a modest pace in 2020, with house prices remaining broadly flat over the next 12 months.
Regular updates on the local property market are published in the weekly BrentfordTW8.com newsletter.
February 7, 2020