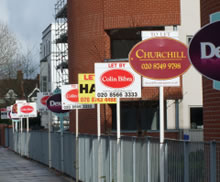
Big Surge in W12 Property Prices
Sharp rises in the value of local homes in latest figures
The latest figures from the Land Registry show a very sharp rise in local property values.
The average price of a home sold in the W12 area during the second quarter of this year was £462,273 up by 14.6% on the previous quarter.
The rise appears to have been across the board with all category of home increasing in value however the headline figure is boosted by the increase in price and volumes for larger properties in the west of the area such as Ashchurch Park Villas.
The rises are even more pronounced compared to the same quarter last year when prices and volumes were very depressed. Average prices were up by 48.1% and volumes have more than doubled.
London overall experienced an increase of 12.2
per cent in June compared to last year. In comparison
to this, the figure for England
and Wales as a whole was
currently 8.4 per cent. London’s
house prices are now around
the same levels they were three
years ago.
London's monthly change brings the
average house price there to £338,027, while the average for
England and Wales is £166,072.
Looking ahead some analysts are not optimistic that the current price strength will be maintained.
Miles Shipside, commercial director of Rightmove, comments: “The number of new mortgages being approved
each month is less than half the number of new sellers, with the imbalance being exacerbated by the increase of
nearly 50% in the number of properties coming to market compared to a year ago. More aggressive pricing is now
the order of the day, which means that conditions are ripe for a strong buyers’ market in the second half of 2010.
This is likely to see the average price gains of 7% for the first half of the year wiped out by year-end, in line with
Rightmove’s original forecast for the year of no net change in prices”.
Shepherd's Bush Property Prices - April - June 2010
| Area | Semi-Det | Sales | Terraced | Sales | Flat/Mais | Sales | Total Averages | Total Sales |
|---|---|---|---|---|---|---|---|---|
| W12 0 | 0 | 0 | 435605 | 9 | 334000 | 4 | 404342 | 13 |
| W12 7 | 0 | 0 | 767166 | 6 | 314313 | 15 | 443700 | 21 |
| W12 8 | 0 | 0 | 498750 | 4 | 319497 | 18 | 352088 | 22 |
| W12 9 | 1206166 | 6 | 672495 | 10 | 331908 | 23 | 553739 | 39 |
| Total | 1206166 | 6 | 594600 | 29 | 323925 | 60 | 462273 | 95 |
| Change over quarter | 9.2% | 100.0% | 2.3% | 38.1% | 7.7% | 5.3% | 14.6% | 17.3% |
| Change over year | 321.9% | 50.0% | 28.1% | 141.7% | 31.8% | 130.8% | 48.1% | 126.2% |
Source: Land Registry
August 11, 2010